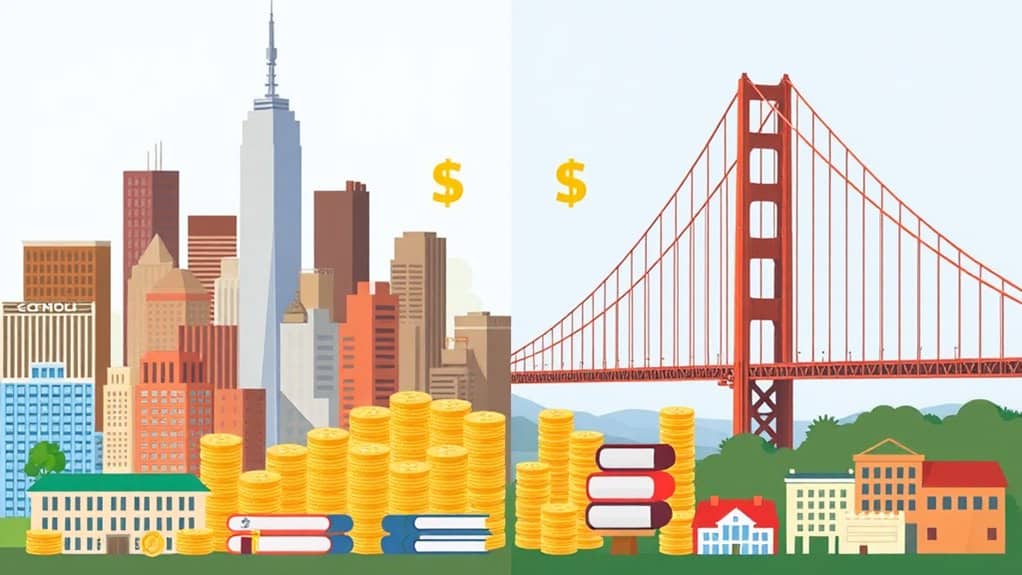
New York and San Francisco's educational systems differ markedly in their funding approaches and structures. NY relies heavily on local funding (56%) and state aid (40%), while SF operates under California's Local Control Funding Formula. You'll find NY's system is centrally managed by the Department of Education, overseeing 1,800 schools across five boroughs, whereas SF's system is more district-based. Both cities emphasize specialized programs, with NY featuring eight specialized high schools requiring SHSAT scores. NY mandates specific professional development for teachers and maintains robust special education services, serving over 200,000 students with IEPs. There's much more to explore about these distinctive educational landscapes.
Funding Sources and Budget Allocation

In accordance with state regulations, New York and San Francisco employ distinctly different approaches to educational funding.
You'll find that New York's system relies on a three-tiered funding structure, with 56% coming from local sources, 40% from state aid, and 4% from federal contributions. The state's Foundation Aid program works to address funding disparities between wealthy and struggling districts. The state's commitment is evident through $507 million increase in Foundation Aid for FY 2025.
When you look at San Francisco's system, which operates under California's Local Control Funding Formula (LCFF), you'll notice a similar mix of funding sources but with different allocation methods.
While both cities face equity issues in their educational funding, New York's recent budget of $35.9 billion for education includes specific provisions like the STAR program to help homeowners with school taxes.
You'll see that New York's system also includes dedicated funding for charter schools and transportation, with $185 million allocated for supplemental tuition.
Both systems endeavor to balance local wealth differences, but they've developed unique solutions.
New York's approach includes annual growth limits tied to personal income, while California's LCFF adjusts based on student populations and specific district needs.
Public School Structure
The public school structures of New York and San Francisco reflect their distinct regional approaches to education governance. While New York's system is well-documented, with the Department of Education managing over 1,800 schools across five boroughs, specific information about San Francisco's structure isn't available in our data. Parent involvement through PTAs and Title 1 PACs plays a crucial role in shaping educational policies and programs.
In New York, you'll find a complex public school governance system that's led by a Chancellor appointed by the Mayor. The district organization includes 32 community school districts and several special districts for alternative education.
- The Panel for Educational Policy votes on major educational policies
- Community Education Councils provide local input and oversight
- The State Education Department sets standards and rules
- A $37.5 billion budget serves over 1.1 million students
New York's system includes various district types, from central school districts to union free districts, each serving different community needs.
The SUNY system operates separately, with 34 state-operated and 30 community colleges.
While we can't make direct comparisons with San Francisco's structure, New York's system demonstrates how large urban districts can organize education delivery effectively.
Specialized High School Programs

Moving from broad system structures to specific educational opportunities, specialized high schools represent New York City's premier academic institutions.
You'll find that eight out of nine of these schools require SHSAT scores as their primary admission criteria, while LaGuardia High School uses a unique audition-based approach combined with academic records. Students begin this process in summer before 8th grade by researching schools and preparing for admissions tests.
Each school offers a distinct specialized curriculum that caters to different interests and career paths.
If you're passionate about STEM, you'll want to explore Bronx Science or Brooklyn Tech, where you can immerse yourself in advanced mathematics and sciences. Brooklyn Tech even offers 19 different STEM majors for you to choose from.
For a strong liberal arts foundation, schools like Stuyvesant and Brooklyn Latin combine rigorous math and science with thorough language programs.
At LaGuardia, you'll find intensive arts training in fields like dance, music, and theater.
You can increase your chances of admission by carefully ranking multiple schools and preparing through specialized middle school programs.
Many successful feeder schools, such as J.H.S. 201 and I.S. 98 Bay Academy, offer targeted SHSAT preparation and maintain strong placement records.
Academic Standards and Testing
Across both coasts, academic standards and testing protocols reveal distinct approaches to measuring student achievement.
You'll find that curriculum alignment varies between California and New York, with both states adapting standards to meet their unique educational needs.
When it comes to assessment practices, here's what you need to know about these educational powerhouses:
- California uses SBAC testing, which adapts electronically to student responses for grades 3-8 and 11
- New York implements state tests and Regents exams throughout K-12 education
- Both states emphasize deep understanding over surface-level knowledge
- Each system shows commitment to thorough assessment across multiple subjects
You'll notice that California's standards focus heavily on conceptual understanding and problem-solving skills, while New York provides detailed frameworks across various subjects, including computer science and social studies.
The testing approaches reflect these differences, with California's adaptive electronic testing system contrasting with New York's traditional assessment model.
Despite their distinct methods, both states maintain rigorous standards aimed at preparing students for future success, though they continue to address challenges like achievement gaps and student preparedness.
Teacher Development and Support

Both NY and SF prioritize robust teacher development programs, but you'll find New York's approach particularly structured through its detailed CTLE requirements. In NY, you're required to complete 100 hours of professional development every five years, guaranteeing continuous professional growth through approved providers like The Teacher's Academy and NYCTD.
When you explore NY's teacher mentorship initiatives, you'll discover programs like the Mentor Teacher-Internship Program, which supports beginning teachers through guided experience. The state also offers specialized programs such as the Albert Shanker Grant Program and Teachers of Tomorrow, creating multiple pathways for professional advancement.
You'll notice that NY's professional development standards emphasize culturally responsive practices and align closely with state learning standards. Through the Teacher and Leader Quality Partnership Program, you can access resources designed to enhance your teaching effectiveness.
The system provides self-paced, online learning opportunities that you can directly apply to your classroom practices, making professional development both practical and accessible. Whether you're a new teacher or a veteran educator, NY's extensive approach guarantees continuous improvement in your teaching career.
Higher Education Landscape
While New York's extensive higher education network includes the nation's largest public system (SUNY) alongside prestigious private institutions, you'll find distinct differences when comparing it to San Francisco's concentrated cluster of research universities.
You'll notice that New York's system serves nearly 900,000 students across 64 SUNY campuses, offering more public options than San Francisco's primarily private-focused landscape.
Both regions stand out as research powerhouses, though New York's combination of public accessibility and private excellence creates a broader range of educational pathways for students to explore.
Research Powerhouses Face Off
Standing at the forefront of higher education, New York University and the University of San Francisco represent distinct approaches to academic research and excellence. Through research collaborations and interdisciplinary initiatives, these institutions have carved unique niches in their respective regions, with NYU embracing a broader scope and USF maintaining focused specializations.
You'll find notable differences in their research emphases:
- NYU leads in engineering and medical sciences, with extensive programs spanning multiple disciplines.
- USF excels in social sciences and humanities, maintaining smaller class sizes for personalized attention.
- Both universities foster strong faculty expertise and research credentials.
- The institutions maintain different research scales, with NYU operating on a larger platform.
When you're exploring these research powerhouses, you'll notice that NYU's global presence and broader program offerings contrast with USF's more targeted approach.
While NYU maintains higher employment rates and post-graduation salaries, USF effectively leverages its San Francisco location for tech and healthcare sector opportunities.
Both universities demonstrate commitment to research excellence, though they pursue it through different pathways that reflect their distinct institutional identities and regional influences.
Public Vs Private Options
Beyond research capabilities, New York's higher education landscape presents a stark contrast between public and private institutions.
You'll notice considerable public institution challenges, particularly in enrollment trends, where public colleges have experienced a 14% decline since 2011. Community colleges face the toughest situation, with completion rates hovering at 44.7% and reduced student services due to funding cuts.
In contrast, private sector advantages are clearly visible in New York's educational system. You'll find that private institutions have shown remarkable resilience, bouncing back from pandemic-related enrollment drops and maintaining higher completion rates than their public counterparts.
With 150 private colleges spread across 198 campuses, you're looking at a robust system that holds more than double the market share compared to public institutions.
When you're considering your educational options in New York, it's important to understand that while both sectors contribute considerably to the state's economy, they're facing different trajectories. Public institutions continue to grapple with funding and enrollment challenges, while private colleges demonstrate greater stability and adaptability in meeting future educational demands.
Special Education Services

Within New York City's public school system, special education services reach an impressive scope, serving more than 200,000 students with IEPs - approximately 19% of the total student population. The system emphasizes inclusion strategies and disability awareness, with over 80% of students receiving services in traditional public schools.
You'll find that special education services vary based on individual needs, with distinct patterns emerging across different demographics. The city's inclusion efforts have led to most students spending time in regular classroom settings, though specific accommodations depend on disability type.
Key aspects of NYC's special education landscape include:
- Higher disability rates in low-income neighborhoods
- Boys receiving IEPs at twice the rate of girls
- Specific learning disabilities ranking as the most common classification
- Graduation rates reaching 74.5% for students with IEPs
You'll notice that NYC's special education program differs from other major cities, with its 19% IEP rate surpassing Chicago's 14% and Los Angeles's 12%.
The city's commitment to inclusive education shows in its placement statistics, with 61% of students with IEPs spending most of their day in regular classrooms, close to the national average of 64%.
Arts and Cultural Integration
When you compare arts programs in New York City and San Francisco schools, you'll find that both cities invest considerably in cultural education, though NYC typically allocates larger funding due to its bigger student population and extensive museum partnerships.
In New York, you'll see programs like the Summer Arts Institute and All-City High School Music Program operating on a massive scale, while San Francisco focuses on intimate partnerships with institutions like SFMOMA and the de Young Museum.
Your child's arts education in either city will benefit from rich cultural resources, though NYC's programs tend to serve more students through its broader network of cultural institutions and established funding channels.
Arts Program Funding Comparison
A stark contrast emerges between New York and San Francisco's approaches to arts program funding and cultural integration.
You'll find that New York maintains a centralized funding structure through NYSCA, allocating nearly $100 million for arts initiatives, while San Francisco relies on fragmented local district funding that often creates equity challenges.
When you look at the numbers, New York's commitment to arts funding becomes clear through these key differences:
- NYSCA dedicates 90% of its funding directly to arts organizations, supporting over 3,000 artists statewide
- Grant amounts typically range from $10,000 to $49,500, providing substantial support for programs
- The arts sector employs 461,425 workers in New York, contributing $151.1 billion to the state economy
- Federal funding through NEA has provided over $100 million in the past five years
In contrast, you'll notice San Francisco's approach depends heavily on individual school districts and local partnerships, creating inconsistent access to arts education.
Schools in high-poverty areas often receive fewer resources than their affluent counterparts, highlighting the need for more equitable funding solutions in the Bay Area.
Cultural Partnerships in Education
Throughout both cities' educational landscapes, cultural partnerships serve as essential bridges between schools and arts organizations, though you'll find stark differences in their implementation and reach.
In New York City, you'll notice a structured approach where nearly 60% of public high schools maintain multiple cultural partnerships, while San Francisco's system relies more heavily on local community connections and varied funding sources.
When it comes to educational equity, NYC's COMPASS NYC program reaches 97,000 youth with diverse cultural experiences, and their culturally responsive-sustaining education approach actively promotes student engagement through cultural identity recognition.
San Francisco's partnership effectiveness varies notably based on resource allocation, with affluent schools typically securing more extensive arts programming. You'll see this disparity reflected in arts accessibility across both cities, though San Francisco's high-poverty schools may receive additional grant funding to help bridge the gap.
The community impact is particularly visible in NYC's initiatives like Teen Thursdays and Urban Advantage, which create structured pathways for cultural diversity in education.
These programs demonstrate how strategic partnerships can enhance student engagement while promoting broader cultural understanding.
Conclusion
You've seen how NY and SF's educational systems each bring unique strengths to the table, with SF investing 23% more per student than NY in 2022. This higher spending hasn't automatically translated to better outcomes, showing that success depends on multiple factors beyond funding. As you consider these differences, remember that both cities continue evolving their approaches to give students the tools they'll need for tomorrow's challenges.


